
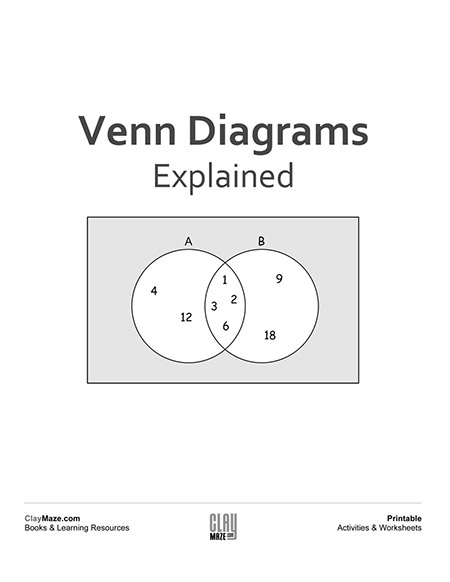
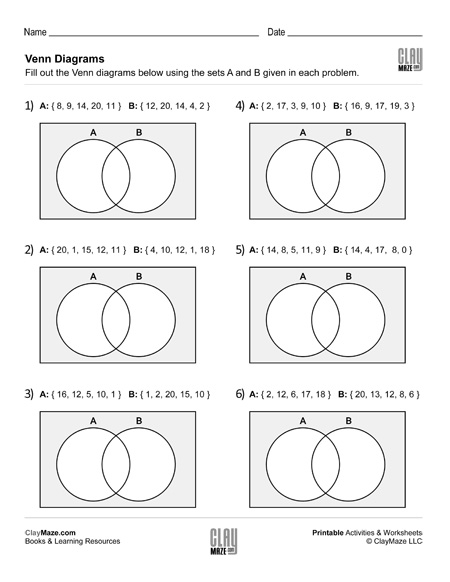
A Venn diagram can be used to organize groups of things in a visual way to show how the groups are similar and how they are different.
The similar objects of the groups are placed in the overlapping section of the diagram while the objects that are only found in their own group are placed in the non-overlapping area of its group’s section.
Example>
Suppose there are 2 sets called A and B containing the numbers as follows:
Set A: { 1, 2, 3, 4, 6, 12 } Set B: { 1, 2, 3, 6, 9, 18}
The numbers found in both sets are: { 1, 2, 3, 6 }.
The rest of the numbers are unique to their own groups.
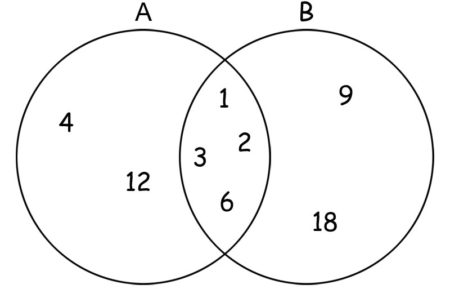
To create a Venn diagram for these 2 sets:
- Draw 2 overlapping circles, each one labeled by its group’s name: A and B.
- Write the contents into the circles:
- Place the common numbers in the overlapping area.
- Place those not common to both in their own, non-overlapping sections.
Download and print our Venn Diagram worksheets:
Fill in the Venn Diagrams (Set 1)
Fill in the Venn Diagrams (Set 2)
Fill in the Venn Diagrams (Set 3)
Fill in the Venn Diagrams (Set 4)
Related Worksheets
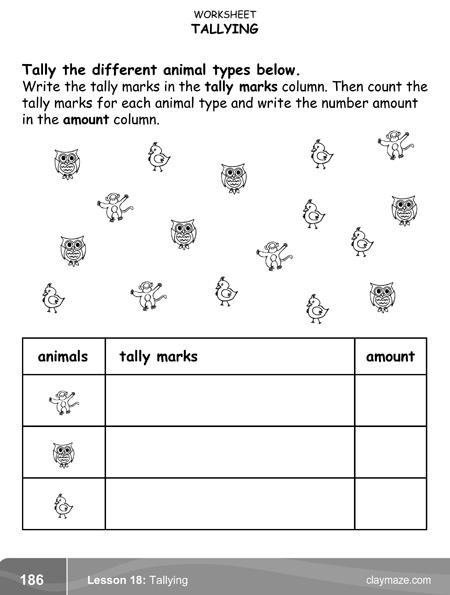
Tally the Animals
This worksheet is from the tallying section of our book, “Mastering the Math Milestone“. On this worksheet, the child will fill out the chart by tallying each different type of animal in the group.
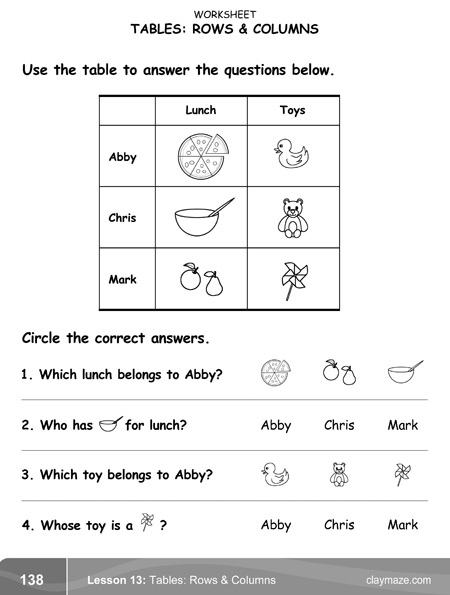
Reading Information in a Table
This worksheet is from the “Mastering the Math Milestone” book. The child is asked to answer questions based on the information in the table using the labels, columns and rows.
Venn Diagram Worksheets – Free Printables
Help your child develop an better understanding of number sets and how they are related as well as recording and reading data.For more explanation of what a Venn diagram is and to see an example, click here.
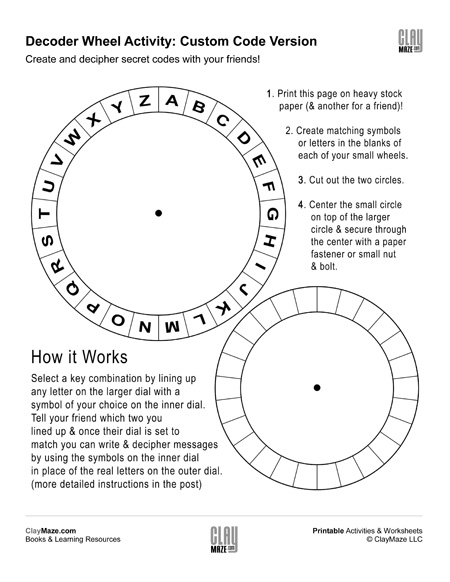
Spy Decoder Wheel – Custom Code Version
This template is the customizable version of our Random Alphabet Decoder Wheel. There are three decoder wheels in all allowing for the coding and decoding of secret messages using random alphabet letters, symbols or your very own code! See the
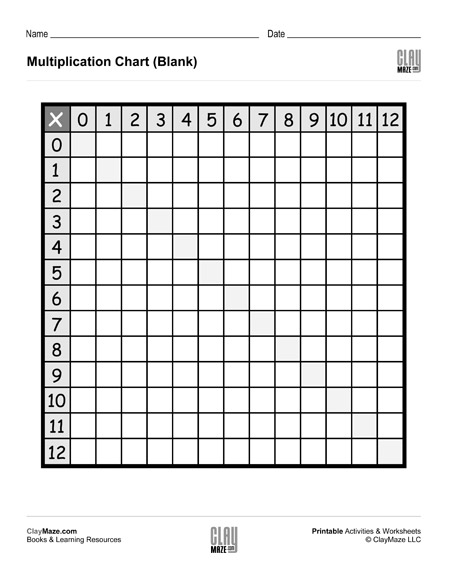
Blank Multiplication Table for Facts Practice
Help your child build multiplication skills with this free math worksheet. This blank multiplication chart for numbers 0-12 is the perfect tool to build confidence and fluency with multiplication facts. What is a Multiplication Chart? A multiplication chart is a

Time Word Problems Worksheet (Grades 5–6)
Looking for effective practice with elapsed time and real-world schedules? This free printable time word problems worksheet is designed for Grades 5–6 and helps students strengthen their understanding of time, duration, and daily routines. The worksheet includes original, multi-step time